COVID-19 Publications and Resources from the BRITE Center and Director, Dr. Mays
Covid-19 Virtual Events
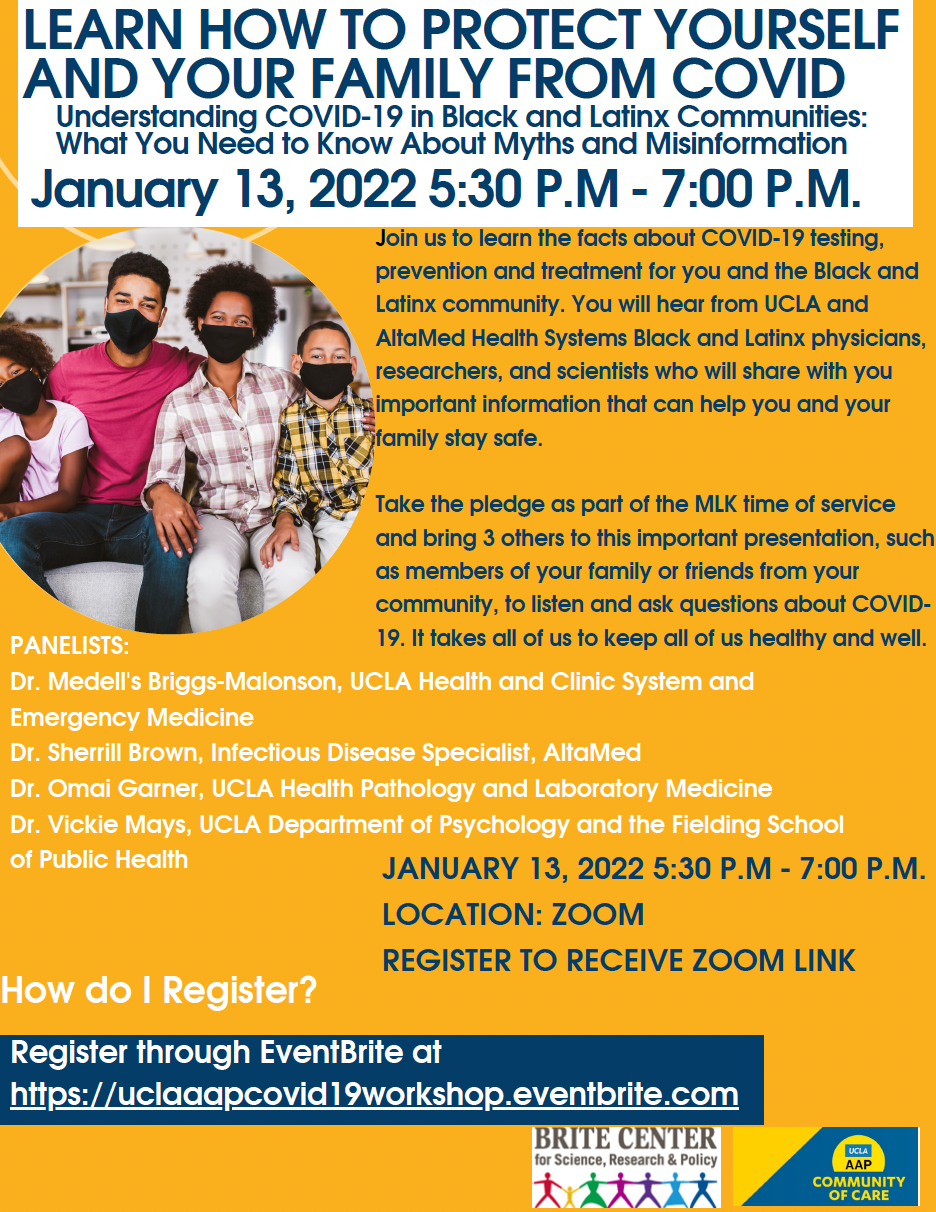
- Learn How to Protect Yourself and Your Family from Covid-19
Click here to register for the event!
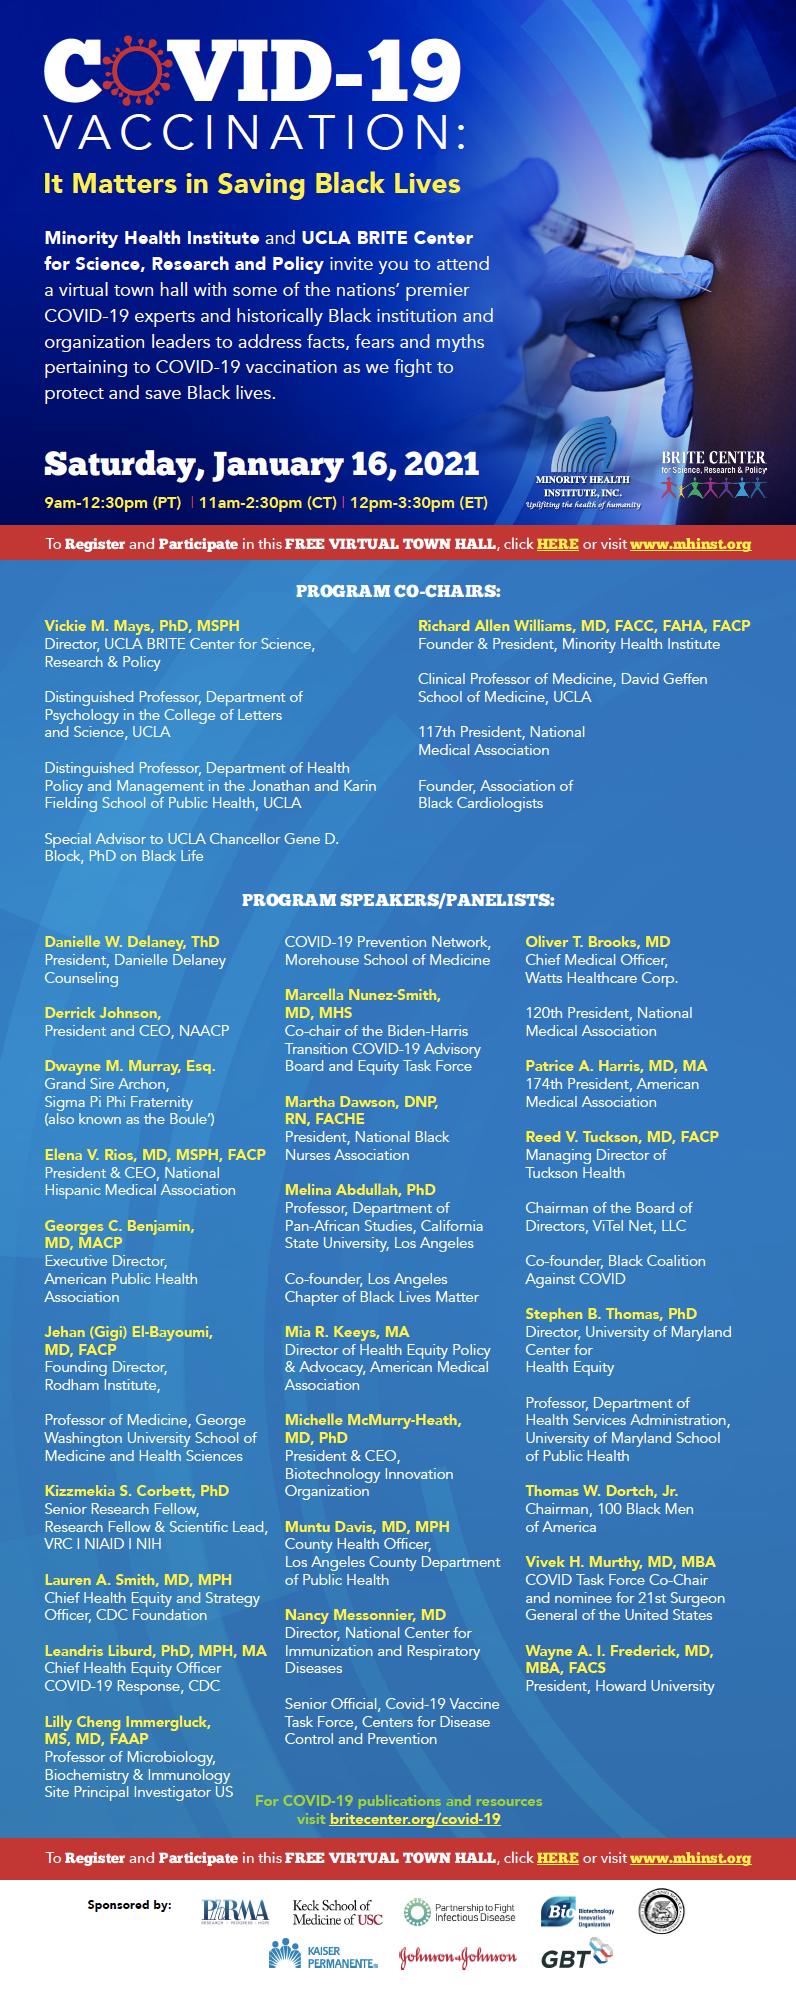
- COVID-19 Vaccination: It Matters in Saving Black Lives Virtual Town Hall
Click here to view a recording of the event (Passcode: RHH*xKi9).
Click here for the program itinerary.
MLK Day of Service
Join us in making a pledge to talk to 3 people in your network about COVID-19 for a MLK Day of Service!
We also hope that you will participate in a day of service by talking with three people in your network, especially your family about their questions about the vaccine and share with them what you have learned. On Monday, January 18th as a part of this UCLA Day of Service, Dr. Briggs-Malonson will organize a group of Black physicians and scientists to answer questions that your family/network may have about the vaccine in general, at 3 PM PST.
For more Q&A please visit www.uclahealth.org/covid-19-faqs
Publications
- COVID-19 Medical Vulnerability Indicators
In an effort to curb the spread of COVID-19 and guide public health interventions, the UCLA Center for Neighborhood Knowledge and UCLA BRITE Center for Science, Research, and Policy developed vulnerability indicators aimed at identifying the communities in California that are most vulnerable to COVID-19 infections. The map includes four important indicators known to significantly increase a person’s medical vulnerability to COVID-19 infection: 1) pre-existing health conditions, 2) barriers to accessing services, 3) built-environment risk and 4) social vulnerability.
Press Release – Elizabeth Kivowitz Boatright-Simon
To help slow the spread of COVID-19 and save lives, UCLA public health and
urban planning experts have developed a predictive model that pinpoints which
populations in which neighborhoods of Los Angeles County are most at risk of
becoming infected.
The researchers hope the new model, which can be applied to other counties and
jurisdictions as well, will assist decision makers, public health officials and
scientists in effectively and equitably implementing vaccine distribution,
testing, closures and reopenings, and other virus-mitigation measures.
The model maps Los Angeles County neighborhood by neighborhood, based on four
important indicators known to significantly increase a person’s medical
vulnerability to COVID-19 infection preexisting medical conditions, barriers
to accessing health care, built-environment characteristics and socioeconomic
challenges.
The research data demonstrate that neighborhoods characterized by significant
clustering of racial and ethnic minorities, low-income households and unmet
medical needs are most vulnerable to COVID-19 infection, specifically areas in
and around South Los Angeles and the eastern portion of the San Fernando
Valley. Communities along the coast and in the northwestern part of the county,
which are disproportionately white and higher-income, were found to be the
least vulnerable.
The model we have includes specific resource vulnerabilities that can guide
public health officials and local leaders across the nation to harness already
available local data to determine which groups in which neighborhoods are most
vulnerable and how to prevent new infections to save lives, said research
author Vickie Mays, a professor of psychology in the UCLA College and of health
policy and management at the UCLA Fielding School of Public Health.
Mays, who also directs the National Institutes of Healthfunded UCLA BRITE
Center for Science, Research and Policy, worked with urban planner Paul Ong,
director of the UCLA Center for Neighborhood Knowledge, to develop the
indicators model, along with study co-authors Chhandara Pech and Nataly Rios
Gutierrez. The maps were created by Abigail Fitzgibbon.
Utilizing data from the UCLA Center for Health Policy Researchs California
Health Interview Survey, the U.S. Census Bureaus American Community Survey and
the California Department of Parks and Recreation, the researchers were able to
determine how the four vulnerability indicators differentially predicted which
racial and ethnic groups in Los Angeles County were the most vulnerable to
infection based on their geographical residence.
Racial and ethnic groups with the highest vulnerability
Preexisting conditions. The authors found that 73% of Black residents live in
neighborhoods with the highest rates of preexisting health conditions like
diabetes, obesity and heart disease, as well as poor overall health and food
insecurity. This was followed by 70% of Latinos and 60% of Cambodians, Hmongs
and Laotians, or CHL. Conversely, 60% of white residents live in areas with low
or the lowest vulnerability.
Barriers to accessing services. Forty percent of Latinos, 29% of Blacks, 22% of
CHL and 16% of other Asians reside in neighborhoods with the greatest barriers
to health care, characterized by high proportions of nonU.S. citizens, poor
English-language ability, a lack of access to computer broadband service, lower
rates of health insurance and poor access to vehicles for medical purposes.
Only 7% of whites live in these neighborhoods.
Built-environment risk. Sixty-three percent of CHL, 55% of Latinos, 53% of
Blacks and 32% of whites live areas considered to be at high or the highest
vulnerability due to built-environment challenges, which include high
population density, crowded housing and a lack of parks and open spaces.
Social vulnerability. According to the Centers for Disease Control,
neighborhoods with high social vulnerability are characterized by lower
socioeconomic status and education attainment, a higher prevalence of
single-parent and multigenerational households, greater housing density, poorer
English-language ability and a lack of access to vehicles, among other factors.
While only 8% of whites live in these neighborhoods, 42% of both Blacks and
Latinos do, as do 38% of CHL.
How the model can help with COVID-19 mitigation efforts
When the pandemic hit, we were slowed down by a lack of science and a lack of
understanding of the ways in which health disparities in the lives of some of
our most vulnerable populations made their risk of COVID-19 infection even
greater, Mays said. We thought elderly and people in nursing homes were the
most vulnerable, yet we found that lacking a number of social resources
contributes to a greater likelihood of getting infected as well.
And while nationwide statistics have shown that the virus has had a
disproportionate effect on low-income communities and communities of color,
knowing precisely which populations are the most vulnerable and where new
infections are likely to occur is critical information in determining how to
allocate scarce resources and when to open or close areas, Mays and Ong said.
If, for example, English-language ability is a barrier to accessing health
information and services in a vulnerable neighborhood, health officials should
develop campaigns in Spanish or another appropriate language highlighting the
availability of testing, the researchers stress. If access to a car is a
barrier for families in an at-risk area, walk-up testing sites should be made
available. When crowded housing in a high-risk neighborhood is the predominant
housing stock, testing resources should be set up for entire households and
hotel vouchers made available to help with quarantining after a positive test.
The data can also provide critical knowledge and insights to social service
providers, emergency agencies and volunteers on where to direct their time and
resources, such as where to set up distribution sites for food and other
necessities. And importantly, identifying the areas and populations with the
highest vulnerability will help decision-makers equitably prioritize
vaccine-distribution plans to include the most vulnerable early.
In the longer term, the researchers say, the model will also provide valuable
information to urban planners so that they can target specific areas for the
development of less-dense housing and more parks and open spaces, creating
healthier neighborhoods that can better withstand future pandemics while
promoting equity in long-term health outcomes.
See below for reports and maps on both Los Angeles County and the state of California.
LOS ANGELES COUNTY
Los Angeles County Interactive Map and Data by ZCTA’s
STATE OF CALIFORNIA
State of California Interactive Map and Data by ZCTA’s
To see the map associated with the state of California, please click “Ok” below.
- Assessing Vulnerability Indicators and Race/Ethnicity
Press Release – Brad Smith
The UCLA Center for Neighborhood Knowledge, led by Professor Paul M. Ong, and supported by UCLA Fielding School professors Vickie Mays and Ninez Ponce and the UCLA Center for Health Policy Research’s California Health Interview Survey, has published a study assessing four vulnerability indicators being used by public agencies to select the most COVID-19 vulnerable neighborhoods for interventions.
These indicators can play a role in prioritizing the provision of pandemic resources and services; consequently, they have implications for how many people of color and minority neighborhoods are served.
This study compares three pre-pandemic indicators and a more recently developed indicator based on pre-existing health conditions. The analysis focuses on the numbers of people of color residing in designated high-vulnerability neighborhoods, and the relative number of minority neighborhoods that fall into the high-vulnerability areas. Race/ethnicity is important because people of color encounter multiple dimensions of inequality that are only partially reflected in the indicators.
The findings show noticeable differences in the groups and places designated as being vulnerable, thus the choice of which indicator to use has highly consequential implications in terms of who is served and who is not along racial lines.
Summary: This study assesses four vulnerability indicators that are being considered by public agencies as policy tools to select the most-at-risk neighborhoods for interventions. These indicators can play a role in prioritizing the provision of pandemic resources and services; consequently, they have implications for how many people of color and minority neighborhoods are served. The study compares three vulnerability indicators developed prior to COVID-19 and one developed in response to the pandemic, the UCLA Pre-Existing Health Vulnerability (PHV) index, which captures the risks or severity of COVID-19 infection due to preexisting health conditions. The PHV index is based on data from the 2020a California Health Interview Survey (CHIS).
Findings: Two sets of assessments are conducted. The first calculates the degree of concordance between pairs of indicators, that is, how frequently they identify the same tracts as being disadvantaged. The analysis finds that low rates of commonality (approximately less than half of all designated tracts); therefore, the choice of indicator inherently translates into a significant variation in the tracts classified as being eligible or ineligible for prioritization.
The second set of assessments examines the differences among the indicators by comparing the racial composition of the residents in designated high-vulnerability tracts, and by comparing the relative number of minority neighborhoods included in high-vulnerability tracts. The analyses find substantial differences among the indicators in population compositions and proportion of minority neighborhoods included. The findings can help ameliorate a policy dilemma.
Despite the reality that African Americans and Hispanics have suffered disproportionately from COVID-19, the 1996 Proposition 209 prohibits the state from explicitly using race as a factor in the provision and distribution of pandemic relief and coronavirus vaccines. The study’s findings provide insights into which of the four vulnerability indicators can serve as a reasonable proxy, one that captures an important underlying mechanism producing systemic racial inequality.
By several criteria, among the indicators that do not explicitly include race/ethnicity as an input, the indicator based on preexisting health conditions (medical vulnerabilities) performs best in including African Americans. A final recommendation is that public agencies should develop and construct new pandemic-oriented indicators to help guide policies beyond racial equity.
Townhall Meetings & Interviews
- Black News Channel: Research Aimed at Residents at Risk – published June 3, 2021: https://youtu.be/E3U3Q3gDyWs
- KTLA News: UCLA Professor Dr. Vickie Mays on Her Recent Co-Authored Study into the Hidden Cost of Being a Black Male – published March 12, 2021: https://ktla.com/morning-news/ucla-professor-dr-vickie-mays-on-her-recent-co-authored-study-into-the-hidden-cost-of-being-a-black-male/
- CBS Los Angeles: COVID-19: Vaccine Line Jumpers Improperly Using Access Codes to Get Vaccinated – published February 24, 2021: https://losangeles.cbslocal.com/2021/02/24/vaccine-equity-line-jumpers-los-angeles-county/ (also featured on KCAL-TV)
- HealthDay: A HealthDay Panel Discussion: Why Are Black and Latino Americans Being Left behind in the Vaccine Roll Out and What’s Needed to Catch Them Up – published February 16, 2021: https://www.youtube.com/watch?v=oGLbSa3Svl4
- BRITE Center: COVID-19 Vaccination: It Matters in Saving Black Lives Virtual Town Hall – published January 16, 2021: https://us02web.zoom.us/rec/share/ (Passcode: RHH*xKi9)
- UCLA Health: Confidence in Crisis: Strengthening Medical Trust within the Black Community during the Pandemic – published January 14, 2021: https://youtu.be/3ityWMNYy04
- KPCC Radio: State of Affairs, Coronavirus: Face Masks Have a Starring Role on TV Now, Weekend Preview – published November 20, 2020: https://www.scpr.org/programs/take-two/2020/11/20/21370/
- ABC7: UCLA Study Identifies LA County Neighborhoods Most Vulnerable to COVID-19 for Vaccine Priority – published November 19, 2020: https://abc7.com/ucla-covid-19-vaccine-los-angeles-priority/8080096/
- KVEA Telemundo: Zonas de Prioridad de Vacunas Contra COVID-19 – published November 19, 2020: https://www.telemundo52.com/fotosyvideos/zonas-de-prioridad-para-vacunas-contra-covid-19/2135280/
- NBC Los Angeles: Who Should Get Vaccinated First – published November 18, 2020 featuring Dr. Paul Ong: https://www.nbclosangeles.com/on-air/who-should-get-vaccinated-first/2465693/
- Diabetes Technology: Virtual International COVID-19 and Diabetes Summit – published on August 26, 2020: https://www.diabetestechnology.org/cds/agenda.shtml
- UCLA Newsroom: Q&A: For Black Men, Wearing a Mask May Be a Health Risk Greater than COVID-19 – published on May 21, 2020: https://www.universityofcalifornia.edu/news/qa-black-men-wearing-mask-may-be-health-risk-greater-covid-19
- Contagion Live: COVID-19: The Psychology of Social Distancing – published on May 21, 2020: https://www.contagionlive.com/news/covid-19-the-psychology-of-social-distancing
- Minority Health Institute Virtual Townhall on COVID-19: “COVID-19: The Battle to Save Black Lives” Town Hall – recorded on April 30, 2020: https://abc7news.com/covid-19-black-lives-minorities-town-hall/6138488/ (Webinar recording in the article)
Media Coverage
- Washington Post: Opinion – With So Much Pandemic Grief, Compassion Needs to Become Corporate Policy – published January 6, 2022: https://www.washingtonpost.com/opinions/2022/01/05/pandemic-grief-employees-companies/
- Outlook: Local Zip Code’s Vaccination Rate Trails Others – published August 26, 2021: https://outlooknewspapers.com/local-zip-codes-vaccination-rate-trails-others/
- Los Angeles Times: Desperately Seeking Hiker I Met On the Trail. But Where to Look? – published July 30, 2021: https://www.latimes.com/travel/story/2021-07-30/missed-connections-la-hiking-trails-can-work-out
- UCLA College Magazine 2021 Edition Feature: Changemakers https://indd.adobe.com/view/e0724a05-8c5e-4a9a-9803-4098bbbf3ac5?startpage=5
- The Guardian: Covid’s Racial Impact in U.S. Clouded by Failure to Collect Race and Ethnicity Data – published July 16, 2021: https://www.theguardian.com/us-news/2021/jul/16/us-covid-coronavirus-race-ethnicity-data
- LA Times: Tommie Smith Believes the Time is Right for Athletes to Protest at Tokyo Olympics – published July 6, 2021: https://www.latimes.com/sports/olympics/story/2021-07-06/should-athletes-take-a-stand-on-the-tokyo-olympics-podium-tommie-smith-says-they-should
- PsyPost: Being Wealthy Protects White Americans from Discrimination But Not Black Americans, Study Suggests – published June 14, 2021: https://www.psypost.org/2021/06/being-wealthy-protects-white-americans-from-discrimination-but-not-black-americans-study-suggests-61132
- California News Times: UCLA Releases Model to Guide Which Areas Should Be Given Vaccine Priority – published June 5, 2021: https://californianewstimes.com/ucla-releases-model-to-guide-which-areas-should-be-given-vaccine-priority-los-angeles-sentinel-los-angeles-sentinel/379459/ (also featured in LA Daily News)
- UCLA Health: The Reckoning – published May 23, 2021: https://www.uclahealth.org/u-magazine/the-reckoning
- Salon: This Is How We Address America’s Mental Health Issue – published May 20, 2021: https://www.salon.com/2021/05/10/this-is-how-we-address-americas-mental-health-crisis_partner/
- Scientific American: COVID Has Put the World at Risk of Prolonged Grief Disorder – published May 19, 2021: https://www.scientificamerican.com/article/covid-has-put-the-world-at-risk-of-prolonged-grief-disorder/
- Daily Bruin: UCLA-led Study Finds Higher Income Does Not Prevent Racial Discrimination – published April 12, 2021: https://dailybruin.com/2021/04/12/ucla-led-study-finds-higher-income-does-not-prevent-racial-discrimination
- Los Angeles Times: Grass-roots Groups Are Helping the Homebound Get Vaccines. They’re Racing against the Clock – published March 30, 2021: https://www.latimes.com/california/story/2021-03-30/grassroots-groups-race-to-vaccinate-homebound-seniors-left-behind
- USA Today: ‘Anticipation and Anxiety’: Derek Chauvin Trial Highlights America’s Racial Divide after George Floyd’s death – published March 10, 2021: https://www.usatoday.com/story/news/nation/2021/03/10/derek-chauvin-trial-highlights-america-racial-divides/6880041002/
- Orange County Register: ‘Black Tax’ of Daily Discrimination Takes Toll on Men of All Education and Income Levels, UCLA Study Says – published March 8, 2021: https://www.ocregister.com/2021/03/08/black-tax-of-daily-discrimination-takes-toll-on-men-of-all-education-and-income-levels-ucla-study-says/ (also featured on San Bernardino Sun, Pasadena Star-NEws, KFI-AM 640, San Gabriel Valley Tribune, Daily Breeze, MyNewsLA, ScienceBlog, Science Codex, LA Daily News, The Press-Enterprise, UCLA Health, ErekAlert, Phys.org, NEws-Medical, Antelope Valley Times)
- Health Day: Mental Health ‘Epidemic’ Threatens Communities of Color Amid COVID-19 – published February 26, 2021: https://consumer.healthday.com/2-26-mental-health-epidemic-threatens-communities-of-color-amid-covid-19-2650796701.html
- CBS Los Angeles: ‘I Feel Pretty Alone Right Now’: Residents Over 65 That Are Homebound Are Struggling To Get Vaccinated – published February 18, 2021: https://losangeles.cbslocal.com/2021/02/18/homebound-seniors-covid-vaccine/ (also featured on Yahoo News)
- Health Day: Health Care After COVID: Racial Disparities Laid Bare – published January 19, 2021: https://consumer.healthday.com/in-depth-1-18-healthcare-after-covid-racial-disparities-laid-bare-2649690963.html
- Consumer Reports: An Easy Plan for Beating the Winter Blues – published January 18, 2021: https://www.consumerreports.org/mental-health/easy-plan-for-beating-winter-blues/
- Fintech Zoom: Covid-19: Racial Disparities Create Obstacles for Covid-19 Vaccine Rollout – published December 5, 2020: https://fintechzoom.com/fintech_news_covid-19/covid-19-racial-disparities-create-obstacles-for-covid-19-vaccine-rollout/
- Healthline: What to Know About the COVID-19 Vaccine Approval and Release in the U.S. – published December 3, 2020: https://www.healthline.com/health-news/what-to-know-about-the-covid-19-vaccine-approval-and-release-in-the-u-s
- Orange County Register: Path Forward: Massive Coronavirus Vaccine Effort Faces Enormous Challenges in California – published November 29, 2020: https://www.ocregister.com/2020/11/29/path-forward-massive-coronavirus-vaccine-effort-faces-enormous-challenges-in-california/ (also featured on LA Daily News, Riverside Press Enterprise, San Bernardino Sun, San Gabriel Valley Tribune, Long Beach Press-Telegram, Whittier Daily News, Torrance Daily Breeze, Ontario-Pomona Daily Bulletin, Redlands Daily Facts, San Jose Mercury News, East Bay Times, Marin Independent Journal, Insurance News Net)
- Association of Schools & Programs of Public Health: Friday Letter COVID-19 Coverage – published November 27, 2020: ASPPH Friday Letter COVID-19 Coverage
- U.S. News & World Report: California Businesses Go from Simmer to Boil Over Newsom’s Fine Dining – published November 24, 2020: https://www.usnews.com/news/health-news/articles/2020-11-24/california-businesses-boil-over-gavin-newsoms-fine-dining
- LA Daily News: Wave of Test Sites Swoop in Responding to Deepening San Fernando Valley Coronavirus Crisis – published November 20, 2020: https://www.dailynews.com/2020/11/20/wave-of-test-sites-swoop-in-responding-to-deepening-san-fernando-valley-coronavirus-crisis/
- Washington Post: UCLA Researchers Identify Priority Neighborhoods for Coronavirus Vaccine – published November 19, 2020: https://www.washingtonpost.com/nation/2020/11/19/coronavirus-covid-live-updates-us/#link-JGZMLVVJYJALBOXY3YSNHX6QQE
- La Opinion: Estudio Revela la Necesidad de Comunidades Latinas de Obtener Primero la Vacuna contra el COVID-19 – published November 19, 2020: https://laopinion.com/2020/11/19/estudio-revela-la-necesidad-de-comunidades-latinas-de-obtener-primero-la-vacuna-contra-el-covid-19/
- CBS Los Angeles: Study Shows Low-Income LA Neighborhoods Are Most at Risk of COVID-19 – published November 18, 2020: https://losangeles.cbslocal.com/2020/11/18/study-shows-low-income-la-neighborhoods-are-most-at-risk-of-covid-19/
- Telemundo 52: UCLA Desarrolla Modelo Predictivo sobre Vulnerabilidad con Respecto al COVID-19 – published November 18, 2020: https://www.telemundo52.com/noticias/local/ucla-desarrolla-modelo-predictivo-sobre-vulnerabilidad-con-respecto-al-covid-19/2134927/
- KCET: UCLA Study Predicts Who’s Most Vulnerable to COVID-19 for Vaccine Priority – published November 18, 2020: https://www.kcet.org/shows/socal-connected/ucla-study-predicts-whos-most-vulnerable-to-covid-19-for-vaccine-priority
- UCLA Fielding School of Public Health: UCLA Model Identifies Neighborhoods that Should Have Priority for Vaccine, Other COVID-19 Help – published November 18, 2020: https://ph.ucla.edu/news/press-release/2020/nov/ucla-model-identifies-neighborhoods-should-have-priority-vaccine-other (also featured on Eurekalert, News Wise, Medical XPress, Newsbreak, UCLA Newsroom)
- Los Angeles Daily News: UCLA Study Identifies Those Most Vulnerable to Coronavirus so They Get Vaccine Sooner – published November 18, 2020: https://www.dailynews.com/2020/11/18/ucla-study-identifies-those-most-vulnerable-to-coronavirus-so-they-get-vaccine-sooner/ (also featured on Pasadena Star News)
- MyNewsLA: UCLA Study Homes in on Who’s Most Vulnerable to COVID-19, Who Needs Most – published November 18, 2020: https://mynewsla.com/business/2020/11/18/ucla-study-homes-in-on-whos-most-vulnerable-to-covid-19-who-needs-most/
- LA Times: Many Californians, Particularly Black Residents, Would Skip Taking COVID-19 Vaccine Today, Survey Finds – published October 23, 2020: https://www.latimes.com/california/story/2020-10-23/many-californians-particularly-black-residents-would-skip-taking-covid-19-vaccine-today-survey-finds
- Popular Science: A Taskforce of Black Doctors is Independently Evaluating COVID-19 Vaccine Candidates – published October 12, 2020: https://www.popsci.com/story/health/covid-19-black-doctor-taskforce/
- Curiosity Shots: COVID-19 Risk And The Black Population: What Are We Overlooking? – published July 14, 2020: https://curiosityshots.com/covid-19-risk-and-the-black-population-what-are-we-overlooking/
- Bloomberg Law: Contract Tracing Needs Community Buy-In to Succeed in Virus fight – published on July 2, 2020: https://news.bloomberglaw.com/health-law-and-business/contact-tracing-needs-community-buy-in-to-succeed-in-virus-fight
- Know Your Vax: Black Lives Matter–Racial Disparities Highlighted by COVID-19 – published on June 30, 2020: https://knowyourvax.com/2020/06/30/black-lives-matter-racial-disparities-highlighted-by-covid-19/
- Track My Exposure: COVID-19 Risk and the Black Population: What Are We Overlooking? – published on June 20, 2020: https://medium.com/@trackmyexposure/what-do-we-overlook-when-we-attempt-to-quantify-coronavirus-risk-to-the-black-population-6ae708e14a2d
- Bloomberg Law: Protests Prompt Re-Examination of Inequality in Medical Research – published on June 18, 2020: https://news.bloomberglaw.com/health-law-and-business/protests-prompt-re-examination-of-inequality-in-medical-research
- STAT News: “Which Death Do They Choose?”: Many Black Men Fear Wearing a Mask More than the Coronavirus – published on June 3, 2020: https://www.statnews.com/2020/06/03/which-deamany-black-men-fear-wearing-mask-more-than-coronavirus/
- The Daily Beast: Will Americans Actually Comply With a Long-Term Lockdown? – published on March 20, 2020: https://www.thedailybeast.com/will-americans-actually-comply-with-a-long-term-coronavirus-lockdown
- The Globe and Mail: A Helping Ear, and Social Stability: Inside China’s Mental-Health Response to a Deadly Virus – published on March 8, 2020: https://www.theglobeandmail.com/world/article-a-helping-ear-and-social-stability-inside-chinas-mental-health/